Portal > SmartBuild > Dashboard
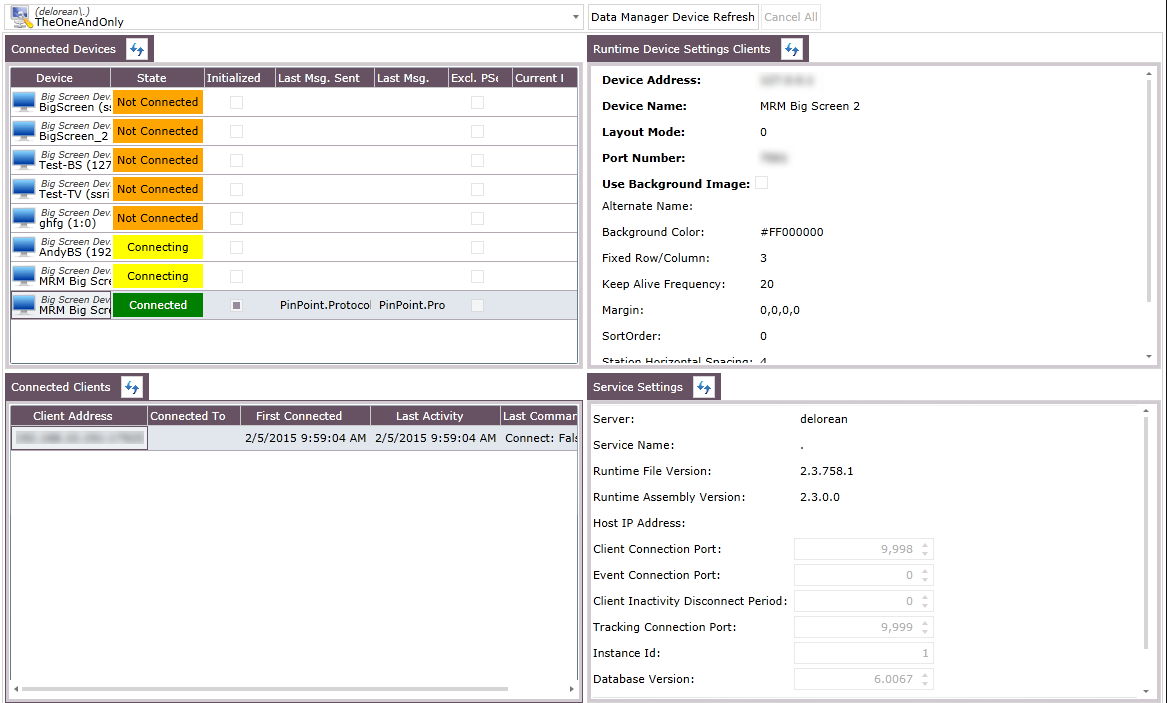
The Dashboard page gives users an overview of all the connections a Data Manager is handling. The Dashboard interface is divided into the following tabs; Connected Devices tab, Connected Clients tab, Runtime Device Settings Clients tab, and Service Settings tab.
Figure 201: Dashboard page and tabs

Nothing is displayed until a Data Manager is selected, which is done using the drop-down menu at the top of the interface.
Figure 202: Data Manager drop-down menu

One of the most important things to know about the Dashboard page is the meaning and use of the Dashboard button Data Manager Device Refresh. Clicking this checks the list of devices and notifications for this Data Manager and adds the missing ones; for instance, if you added something new, clicking Data Manager Device Refresh will cause it to be recognized. It does not affect currently connected devices or notifications even they have been changed. If you changed a notification, you need to restart the Data Manager. If you changed the IP of a tool, you need to reload and restart.
Figure 203: Data Manager Device Refresh button

The following definitions summarize concepts you will encounter in this section.
Table 29: Dashboard page definitions
|
Term |
Definition |
|---|---|
|
Data Manager |
The Data Manager is a Windows service that manages communication between the physical world and client applications. The Data Manager has three main modules: •Device Manager: provides a communication layer between TCP/IP, and OPC devices using Device specific drivers (e.g., Open Protocol Tools, PLCs, Stack Lights, Tester Devices, PINpoint Big Screens, etc.). •Event Manager: routes inbound events from client applications to various subsystems both internal and external. •Tracking Manager: informs the Client Application what product to build, and informs subsystems with updates from the Client concerning the progress of the product assembly. |
|
Device |
In PINpoint, a device is a physical tool used in production that is capable of interacting with the PINpoint Data Manager. |
|
Data Manager Device Refresh |
Checks the list of devices and notifications for this DM and adds the missing ones. If you added something new it will be recognized. It does not affect currently connected devices or notifications even if you changed them. If you changed a notification you need to restart the DM. If you changed the IP of a tool you need to reload and restart. |
|
Reload |
Loads the configuration of a specific device from the DM memory (not SmartBuild). This is used if you want to get the DM to try to connect to a tool which it is for some reason not connecting to. |
|
Reload Configuration and Restart |
Downloads the configuration from SmartBuild for a specific device and commands the DM to restart its connection with the updated configuration. This is used if you have changed the IP of a tool and want to get the DM to connect to it. |
|
Stop |
Stops all communication to a specific device. This is used if you have disconnected a device from the network for a long period of time. It will improve performance if the DM is not constantly attempting to connect. |
Interaction of the Data Manager with SmartBuild
The Data Manager interacts with the functionality of other aspects of SmartBuild in differing ways. It is important to understand how, and what the ramifications of making changes are.
Hardware Tab
•Addition of stations and client button events are made on a save.
•Addition of input sources or big screens require interaction with the appropriate Data Manager before they will fully function.
Build Tab
•Changes to the build page do not take effect until the Tracking Manager is restarted.
Products Tab
•Changes to the products tab take effect when a serial number which uses the steps from that product is loaded. Logging in and out of the client counts as loading the product again.
Notifications Tab
•Addition of notifications requires a device refresh.
•Modification of existing notifications requires a restart of the Event Manager.
Messaging Tab
•Messages are sent immediately.
Dashboard Tab
•Everything is immediate.
Advanced Tab
•Changes to relationships of items are immediate and do not require saving.
•All changes require an immediate save.
•All changes follow the rules outlined in the other tabs.
•Addition of input sources or big screens require interaction with the appropriate Data Manager before they will fully function.
•Addition of stations and client button events are made on a save.
•Changes or addition of any reasons will appear as soon as the client calls the item such as pushing the bypass step button.
Before you can view the status of any devices or clients, you first have to select the Data Manager they’re associated with. To do this, follow these steps.
1.If you are not already in the SmartBuild interface, click on the Portal > SmartBuild button. The SmartBuild interface opens.
2.On the SmartBuild panel, select Dashboard. The Dashboard workspace opens.
3.Click the Please select a Data Manager drop-down menu. The list of available Data Managers is displayed.
Figure 204: Data Manager drop-down menu

4.Click the Data Manager you want to work with to select it. The tabs display the information available for that Data Manager.
Figure 205: Dashboard page with Data Manager selected

When a Data Manager is selected, clicking the Data Manager drop-down menu will make the Clear & Refresh option available. Clicking it will clear the current Data Manager selection and all of the data displayed in the tabs. As well, it will query the database for any new Data Managers or changes made to the existing ones.
When a Data Manager is selected, the devices associated with it (whether or not they are currently connected to it) are displayed here, along with their connection status, and the status of several other attributes.
Figure 206: Connected Devices tab
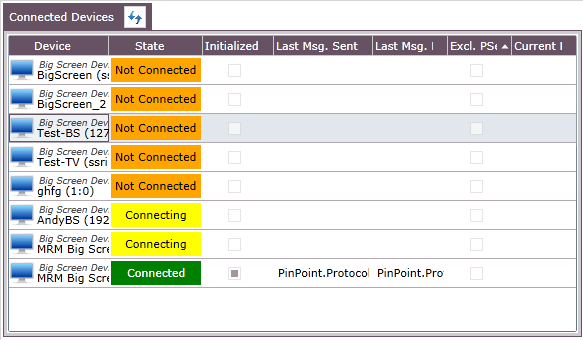
Table 30: Connected Devices statuses
|
Attribute |
Description |
|---|---|
|
Device |
This displays the device type and the specific name of the individual device as it appears in PINpoint. |
|
State |
This displays the connection status of the device with regard to the Data Manager. A device can have one of three statuses: •Not Connected (orange) •Connecting (yellow) •Connected (green) |
|
Initialized |
If filled, this indicates that the device is initialized. |
|
Last Msg. Sent |
This displays the last message sent from the Data Manager to the device. |
|
Last Msg. Rcvd. |
This displays the last massage received by the Data Manager from the device. |
|
Excl. PSet |
If checked, SmartScreen will override all other PSet choice selections made by the controller and will select the PSet desired. |
|
Current PSet |
Designates the default PSet. |
![]()
Each tab features a Refresh button on its tab title, enabling you to refresh the contents of the tab and view any changes in status since the last refresh. Refreshing this tab simultaneously refreshes the Runtime Device Settings Clients tab.
Every device listed in a Device Manager’s Connected Devices tab can be stopped, restarted, and have its configuration reloaded (then restarted) from within the Connected Devices tab. To do so, right-click the device you want to work with, and select the appropriate option from the context menu that opens.
Figure 207: Device restart/reload/stop menu
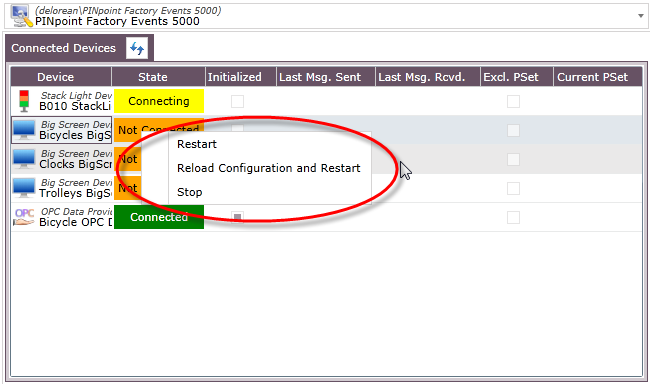
Table 31: Menu options
|
Option |
Description |
|---|---|
|
Restart |
Selecting this restarts any device with the last configuration loaded into it. |
|
Reload Configuration and Restart |
Selecting this loads the current configuration into the device and then restarts it. |
|
Stop |
Selecting this immediately stops the device. |
When a Data Manager is selected, this tab displays the SmartScreen clients connected to that Data Manager, and the status of certain attributes.
Figure 208: Connected Clients tab
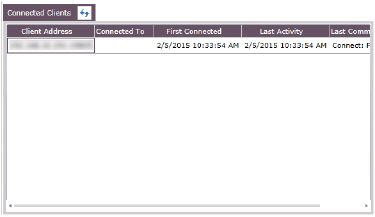
Table 32: Connect Clients statuses
|
Attribute |
Description |
|---|---|
|
Client Address |
This is the IP address of the SmartClient. |
|
Connected To |
This is the IP address to which the Client is connected, if any. |
|
First Connected |
This is the date and time at which the SmartClient connected to the Data Manager. |
|
Last Activity |
This is the date and time of the last recorded interaction by the SmartClient with the Data Manager. |
|
Last Command |
This is the last command of the SmartClient recorded by the Data Manager. |
|
User |
This is the user logged in at the SmartClient. |
![]()
Each tab features a Refresh button on its tab title, enabling you to refresh the contents of the tab and view any changes in status since the last refresh.
Runtime Device Settings Clients tab
When a device is selected in the Connected Devices tab, the Runtime Device Settings Clients tab displays the attributes of that device and their configured values. Exactly what attributes are displayed is dependent on the device type of the selected device.
Figure 209: Runtime Device Settings Clients tab

![]()
Each tab features a Refresh button on its tab title, enabling you to refresh the contents of the tab and view any changes in status since the last refresh. Refreshing this tab simultaneously refreshes the Connected Devices tab.
When a Data Manager is selected, this tab displays the settings for that Data Manager.
Figure 210: Service Settings tab
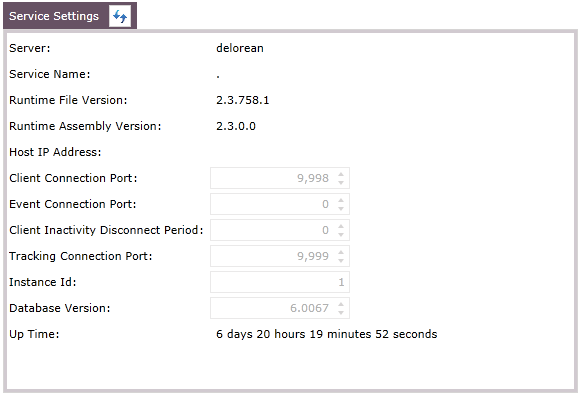
Table 33: Service settings Attributes
|
Attribute |
Description |
|---|---|
|
Server |
This is the name of the server as it appears in PINpoint. |
|
Service Name |
The IP address of the server |
|
Runtime File Version |
The file version being used for Runtime Devices. |
|
Runtime Assembly Version |
The assembly version being used for Runtime Devices. |
|
Host IP Address |
The IP address of the host being used for Runtime Devices. |
|
Client Connection Port |
This is the port to which SmartScreen clients should be configured in order to connect to the server. |
|
Event Connection Port |
This is the port to which Events should be configured in order to connect to the server. |
|
Client Inactivity Disconnect Period |
This is the amount of time, in seconds, at which an inactive client connected to the server will be automatically disconnected from it. |
|
Tracking Connection Port |
The port at which the service communicates with the Tracking Server. |
|
Instance Id |
The instance number of the data manager running on the server, usually 4040. If setting up a different data manager on the same server you must change the instance ID and the client connection port, and event client connection port. |
|
Database Version |
Version number of the database. |
|
Up Time |
This is the amount of time that the service has been running relative to the time the Data Manager was chosen in the Dashboard, or the last refresh operation affecting the Service Settings tab was run. |
![]()
Each tab features a Refresh button on its tab title, enabling you to refresh the contents of the tab and view any changes in status since the last refresh. Refreshing this tab simultaneously refreshes the three other tabs.
It is possible to cancel a Data Manager connection attempt or refresh operation that is taking too long to complete. To do this, click the Cancel All button at the top of the interface, which is activated by connection and refresh operations and deactivated when they complete.