Portal > Reports
PINpoint provides a variety of reports to document the operations and performance of production lines and their particular stations, and the ability to choose which details to display, and how the information is displayed.
PINpoint reports are available in five main categories:
•Product Reports, which focus on a particular product, represented by a serial number, as it progresses through production (see Heading2)
•Fastening Reports, which focus on various aspects of Fastening operations (see Heading2)
•Andon Reports, which focus on Andon Events and their impact on production (see Heading2)
•Analyze Reports, which provide tools to finely or broadly examine the relationship of Events, Lines, Products, and time periods (see Heading2)
•Operator Report, which provides contact information, IDs, most recent login, and roles, qualifications, and certifications for the selected Operator (see Heading2).
Portal > Reports > Product Reports
Product Reports are designed to provide information, about a specific product serial number, in PDF format. These reports can be downloaded in either PDF or Excel format, and can be directly printed without the requirement of being downloaded. Product Reports are available in the following types:
•Product Report (see Heading3)
•End of Line Report (see Heading3)
Production Reports Definitions
The following definitions summarize concepts you will encounter in this section.
Table 122: Production Reports definitions
|
Term |
Definition |
|---|---|
|
Exception |
An Operation in a Production Step that falls outside the acceptable parameters; e.g., a Fastening Operation where the torque applied exceeds the tolerances. |
|
Legend |
The Product Report Legend is a list of icon explanations nested under the Legend icon. |
A Product Report provides a view of the status and history of a specific item (or group of items) identified by a serial number, and gives the user various options with regard to what information about the item should be included in the report and the format in which that information should be presented.
NoteSerial number references are available in the Portal > Tracking > Work Orders tab. For more information, see Heading3.
To create a Product Report, follow these steps.
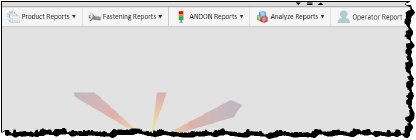
1.If you are not already in the Reports interface, click on the Portal > Reports button. The PINpoint Reports page opens.
Figure 391: Reports headers
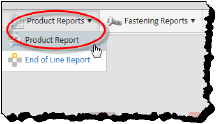
2.Click the Product Reports drop-down menu and click Product Report.
Figure 392: Select Product Report
The Product Report tab opens.
Figure 393: Product Report tab
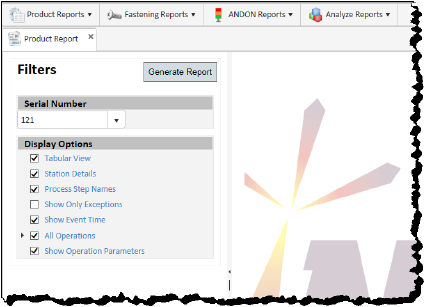
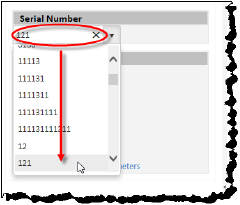
3.In the Filters pane, use the Serial Number drop-down list to select the product for which you want to generate a report.
Figure 394: Select product
4.In the Filters pane, use the Display Options pane to select the options that will format the report and determine its contents:
Table 123: Product Report Display Options
|
Attribute |
Description |
|---|---|
|
Tabular View |
Selecting this option presents the requested information in tables with category headers. De-selecting this option presents the requested information in declarative statements as ordinary text. |
|
Station Details |
Selecting this option presents: •the time the job started and ended at the Station •its expected duration •how long the job actually took to complete (assuming it has been completed at the report is generated). |
|
Process Step Names |
Selecting this option presents operations headed by the name of the Process Step to which they belong. |
|
Show Only Exceptions |
Selecting this option presents specific data about an operation only when it throws an exception; otherwise, the operation displays “[no exception]”. This option is disabled by default. |
|
Show Event Time |
Selecting this option presents the time at which an operation took place. |
|
All Operations |
By default, this option returns results for all the following operations: •Fastening: Returns results for all Fastening operations at Stations where the product has been. •Scan: Returns results for all Scan operations at Stations where the product has been. •Check Box: Returns results for all Check Box operations at Stations where the product has been. •Tester Operations: Returns results for Tester Operations performed during particular steps. De-selecting All Operations also de-selects all of the subordinate operations. De-selecting any subordinate operation causes All Operations to be partially checked. De-selecting every subordinate operation also de-selects All Operations. |
|
Show Operation Parameters |
Selecting this option presents the Expected Values for the operation (if any) for comparison to the actual Recorded Value results of the operation. |
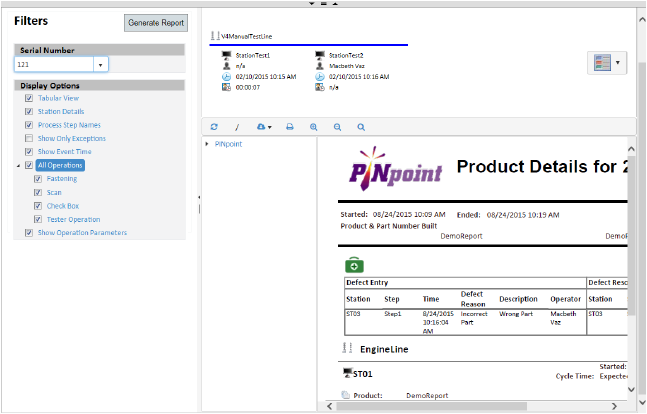
5.When you have completed selecting the Display Options, click the Generate Report button. The report is generated and displayed in PDF format.
Figure 395: Product Report view
Navigating the Report
When the Product Report is generated, it is presented to you in the right side of the Product Report tab.
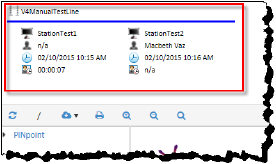
Line Digest
The top section of the presentation area contains a digest of the job information at each Station, including:
•Station name
•Operator
•Job start time
•Job duration time
Figure 396: Job digest information
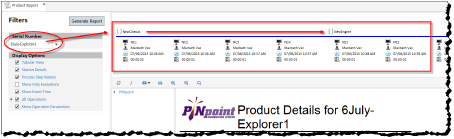
NoteNote that it is in fact possible for the digest to display information for a particular serial number across lines if multiple lines are involved in the production of the item represented by that serial number.
Figure 397: Serial Number spanning multiple lines
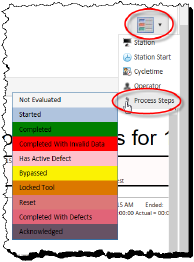
Legend

The Product Report Legend is a list of icon explanations nested under the Legend icon. To view the menu, hover the mouse pointer over the icon. To view sub-menus (if any), hover the mouse pointer over the icon keys. For Product Reports, only Process Steps has a sub-menu, which gives explanations of the meanings of the color codes that accompany Process Steps in the main body of the report.
Figure 398: Product Report legend
Report Bookmarks
The generated report is presented in PDF format, with its key sections listed in an expandable/collapsible bookmarks pane on the left. Clicking a bookmark presents the linked section at the top of the PDF display (within the limitations of the length of the document).
Figure 399: Report bookmarks pane
PDF Icons
The PDF display pane itself is topped with icons that serve various functions.
Table 124: PDF icons
|
Icon |
Purpose |
|---|---|
|
|
The Refresh icon enables you to rebuild the report with current results without the need of reconfiguring the report from scratch. |
|
|
Separator. |
|
|
The Export icon enables you to download the report to a local or network directory in your choice of PDF or Excel file format. |
|
|
The Print icon enables you to print the report. Clicking the icon opens your computer’s Print dialog, enabling you to select the printer. |
|
|
Clicking the Zoom In icon increases the magnification of the report. |
|
|
Clicking the Zoom Out icon decreases the magnification of the report. |
|
|
The Toggle Full Page/Page Width icon toggles the report view between fitting the page width to the available horizontal space and fitting the entire page to the available vertical space. |
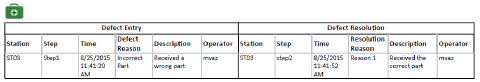
Defect Entry Table
At the beginning of every Product Report is the Defect Entry table (provided there are defects to report). This highlights the details of the defects reported, and the details of their resolution, if any. As elsewhere in PINpoint, resolved defects are represented by a green medical bag icon, and unresolved defects by a red one.
Figure 400: Defect Entry table
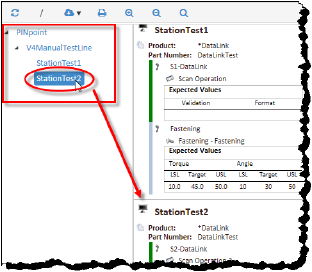
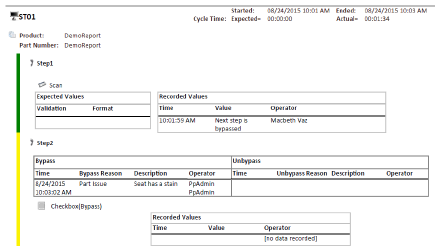
Station Section
Station sections are provided in the report in the order in which they occur on the Line(s) involved. Each Station section features a table for each of its Process Steps, providing the details of the process of that Step and its ultimate status, including bypasses and the reasons for them.
Figure 401: Station section
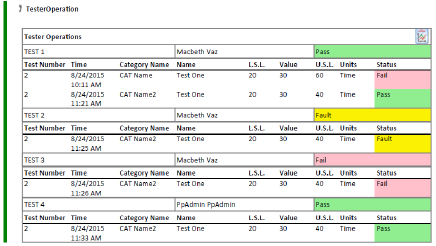
Tester Operation Step Table
A special sub-category of Step table is the Tester Operation Step table. This shows the outcome of Tester Operations conducted at a Station, including the measured results of those tests and their ultimate status. As well, the graph icon at the upper right of the table, when clicked, provides a view of the metrics of the Test Operations in a the form of a graph.
Figure 402: Tester Operation Step table
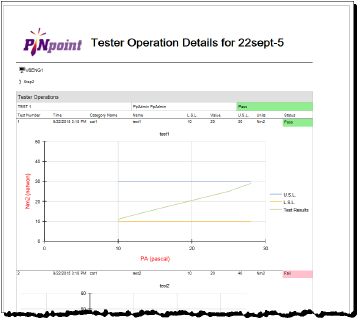
Clicking the Graph icon at the head of the Tester Step table opens the Tester Operation Details graphs for that serial number.
Figure 403: Tester Step Graph icon
![]()
Figure 404: Tester Operation Details graphs
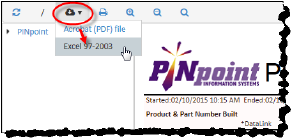
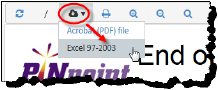
Export to Excel
You can export the report to Excel for download. To do so, click the Export button in the PDF icons bar and select Excel 97-2003.
Figure 405: Export to Excel
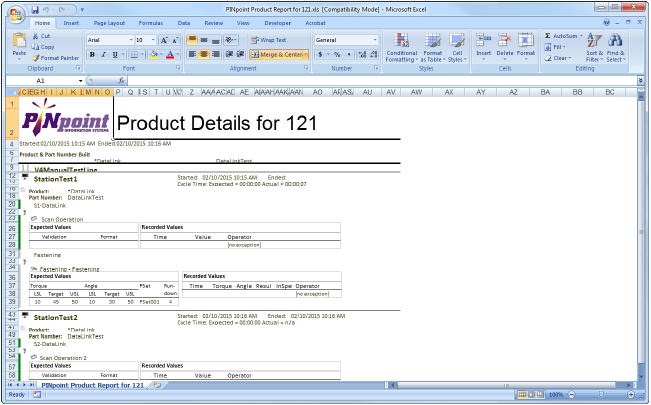
A dialog opens enabling you to save the file locally or open it directly in Excel (presuming it is installed on your computer).
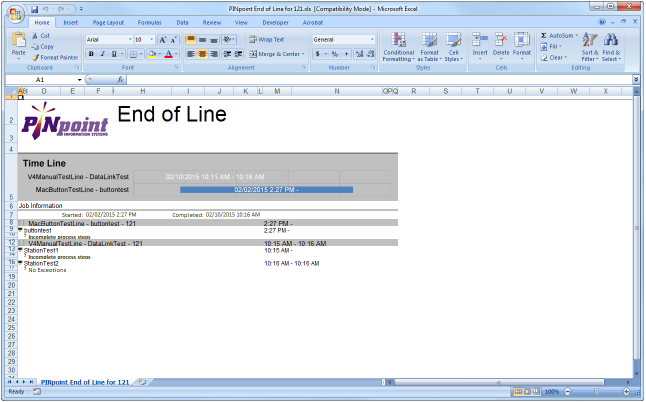
Figure 406: Product Report open in Excel
An End of Line Report details the stations through which an item, identified by a serial number, has passed. It lists the processes that have been performed on the item, and highlights steps which were not completed, or were bypassed.
NoteSerial number references are available in the Portal > Tracking > Work Orders tab. For more information, see Heading3.
To create a Product Report, follow these steps.
1.If you are not already in the Reports interface, click on the Portal > Reports button. The PINpoint Reports page opens.
Figure 407: Reports headers
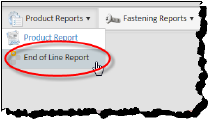
2.Click the Product Reports drop-down menu and click End of Line Report.
Figure 408: Select End of Line Report
The End of Line Report tab opens.
Figure 409: End of Line Report tab
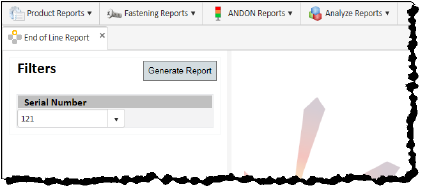
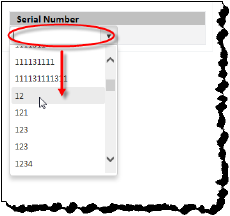
3.In the Filters pane, use the Serial Number drop-down list to select the product for which you want to generate a report.
Figure 410: Select product
4.Click the Generate Report button. The report is generated and displayed in PDF format.
Figure 411: End of Line Report view
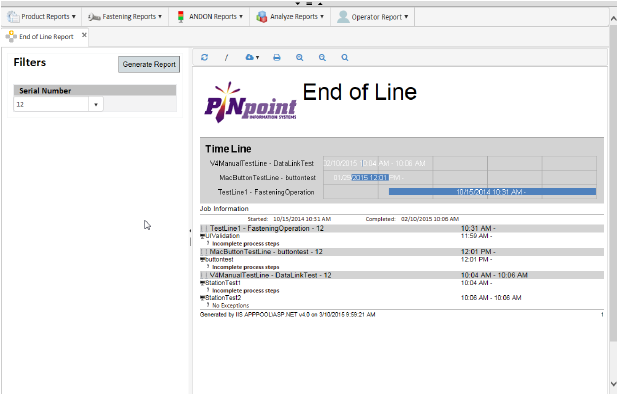
Navigating the Report
When the End of Line Report is generated, it is presented to you in the right side of the Product Report tab.
Time Line
The Time Line section at the top of the report shows the processes that have been performed on the item, the date and time of those processes, and their duration.
Job Information
The Job Information section of the report shows the stations the item has passed through, the processes performed on the item there and when they were performed, and the nature of any exceptions that may have occurred.
PDF Icons
The PDF display pane itself is topped with icons that serve various functions.
Table 125: PDF icons
|
Icon |
Purpose |
|---|---|
|
|
The Refresh icon enables you to rebuild the report with current results without the need of reconfiguring the report from scratch. |
|
|
Separator. |
|
|
The Export icon enables you to download the report to a local or network directory in your choice of PDF or Excel file format. |
|
|
The Print icon enables you to print the report. Clicking the icon opens your computer’s Print dialog, enabling you to select the printer. |
|
|
Clicking the Zoom In icon increases the magnification of the report. |
|
|
Clicking the Zoom Out icon decreases the magnification of the report. |
|
|
The Toggle Full Page/Page Width icon toggles the report view between fitting the page width to the available horizontal space and fitting the entire page to the available vertical space. |
Export to Excel
You can export the report to Excel for download. To do so, click the Export button in the PDF icons bar and select Excel 97-2003.
Figure 412: Export to Excel
A dialog opens enabling you to save the file locally or open it directly in Excel (presuming it is installed on your computer).
Figure 413: End of Line Report open in Excel